|
|
|
|
Chapter 6 Meat Consumption Statistics
 This entry summarises the amount of meat people eat worldwide and is based on official statistics from the Food and Agriculture Organization of the United Nations. Animals and meat on this page mean livestock and poultry and exclude sea food (see Fish Statistics). This entry summarises the amount of meat people eat worldwide and is based on official statistics from the Food and Agriculture Organization of the United Nations. Animals and meat on this page mean livestock and poultry and exclude sea food (see Fish Statistics).Summary
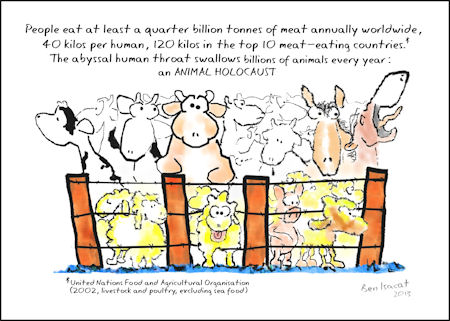
 More & More Meat The figures for meat consumption in the tables below are based on statistics from the Food and Agriculture Organization of the United Nations (FAO). FAO started collecting records in 1961. Their statistics show that the average amount of meat consumed per person has doubled over the last 40 years, increasing steadily from 21 kilograms per person in 1961 to 40 kilograms per person in 2002. Most of this growth is in the developing countries as their populations and incomes increase. China, for example, eats over 20 times its 1961 tonnage. However, although China is the biggest meat eating country (Table 1) the average consumption per Chinese is 52 kg per year, way below America at 125 kg of meat per human per year (Table 2) and western European counties, such as Britain at 80 kg of meat per human annually. According to the UN, the average meat consumption of livestock (cattle, sheep, etc and not including sea food) per human in 2005 was 41 kilograms, and will reach 54 kilograms per person in 2050 (The State of Food and Agriculture. Food and Agriculture Organization of the United Nations, 2009). In addition to meat, people are consuming more eggs and milk and this increased consumption has been called the 'Livestock Revolution'.  Click to go to silhouettes. Minimum Human Meat Consumption These FAO statistics exclude fish. To include fish in human meat consumption you might add about an extra third to the tables below (which are for livestock and poultry only). However, the results will still be minimum figures of human meat consumption. It is not possible to collect totally accurate statistics about millions of animals from all over the world. As FAO admits, "Data is reported by individual countries, which may have varying capacities for data collection." Therefore the statistics on this page are only a rough guide to consumed animal tonnage and should be look upon as minimum figures.
For the source of these figures see Notes for Tables 1 & 2, below.Average Annual Meat Consumption per Human
For the source of these figures see Notes for Tables 1 & 2, below.Notes for Tables 1 & 2 Figures from Tables 1 and Table 2 are based on statistics collected by the Food and Agriculture Organization of the United Nations (FAO), FAOSTAT on-line statistical service (FAO: Rome, 2005). Earth Trends, World Resources Institute, displays FAO statistics online as the Agriculture and Food Searchable Database. Table 1 is from Meat Consumption: Total and Table 2 is from Meat Consumption per Capita (both accessed online February 2008). FAO define meat consumption as "...the total meat retained for use in country for each country per year. Total meat includes meat from animals slaughtered in countries, irrespective of their origin, and comprises horsemeat, poultry, and meat from all other domestic or wild animals such as camels, rabbits, reindeer, and game animals." Conclusion For the foreseeable future, perhaps for as long as humanity persists, billions of animals will continue their cataclysmic fall every year down the abyssal human throat.
›› To Entries & Home |
Free Illustrations
|
|||||||||||||||||||||||||||||||||||||||||||||||||||||||||||||||||||||||||||||||||||||||||||||||||||||||||||||||||||||||||||||||||||||||||||||||||||||||||||||||||||||||||||||||