Pig & Hog Statistics


Summary
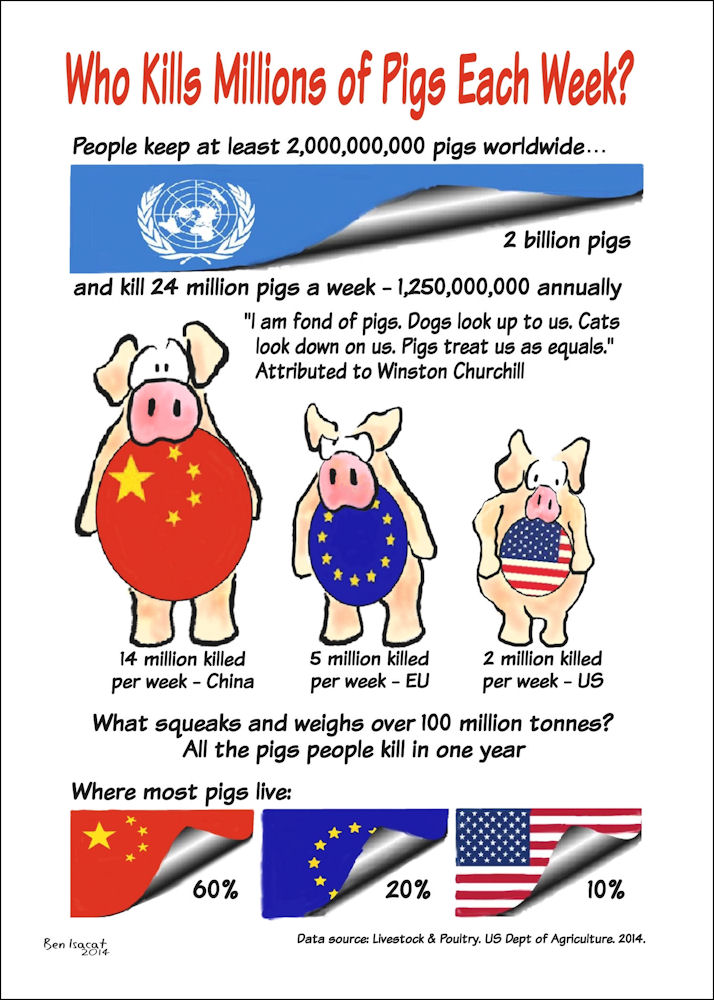
- People worldwide keep about two billion pigs (Table 1).

- At least half the world's pigs live in China and 85 percent of pigs live in three countries: China, European Union and United States (Table 1).
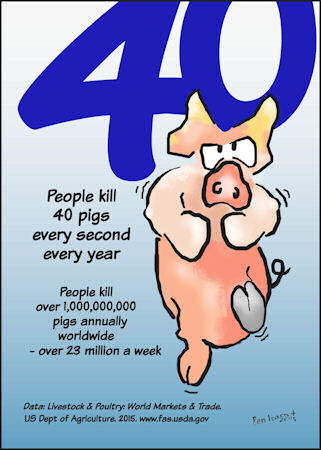
- People kill over one billion pigs annually worldwide, an average of 23 million pigs a week (Table 2).
- Three countries kill about 85 per cent of the world's pigs: China, European Union and United States, respectively about 12 million, five million and two million pigs per week (Table 2).
 Numbers of Pigs People Keep Worldwide
Table 1. Total Number of Pigs People Keep Worldwide.
Top ten countries & Worldwide for years 2008 to 2012.
Figures are in millions. |
| |
2008 |
2009 |
2010 |
2011 |
2012 |
| China |
1,080 |
1,119 |
1,148 |
1,118 |
1,117 |
| European Union 27 states |
418 |
411 |
414 |
411 |
407 |
| United States |
183 |
182 |
179 |
180 |
183 |
| Brazil |
68 |
70 |
72 |
75 |
76 |
| Russia |
43 |
45 |
47 |
47 |
50 |
| Canada |
45 |
42 |
41 |
41 |
41 |
| Japan |
27 |
28 |
28 |
27 |
27 |
| Mexico |
25 |
25 |
25 |
25 |
25 |
| Korea, South |
23 |
23 |
24 |
20 |
22 |
| Ukraine |
14 |
14 |
16 |
16 |
16 |
| Others |
24 |
15 |
16 |
16 |
16 |
| World Total |
2,012 |
1,972 |
2,008 |
1,972 |
1,979 |
Source: see Notes for Tables, below.
Numbers of Pigs People Kill Worldwide
Table 2. Number of Pigs People Kill Worldwide.
Top ten countries & Worldwide for years 2008 to 2012.
Figures are in millions. |
| |
2008 |
2008 |
2010 |
2011 |
2012 |
| China |
637 |
656 |
678 |
641 |
658 |
| European Union 27 states |
258 |
258 |
262 |
260 |
258 |
| United States |
115 |
115 |
114 |
115 |
117 |
| Brazil |
35 |
36 |
37 |
38 |
38 |
| Russia |
27 |
29 |
30 |
30 |
32 |
| Canada |
31 |
30 |
29 |
28 |
28 |
| Japan |
17 |
18 |
18 |
17 |
17 |
| Mexico |
16 |
16 |
16 |
16 |
16 |
| Korea, South |
14 |
15 |
15 |
12 |
15 |
| Ukraine |
7 |
7 |
8 |
8 |
8 |
| Others |
15 |
9 |
10 |
10 |
10 |
| World Total |
1,171 |
1,187 |
1,125 |
1,175 |
1,196 |
Source: same as for Table 1.
Notes for the Tables
The source for the figures in Table 1 and Table 2 is
Livestock and Poultry: World Markets and Trade. United States Department of Agriculture. www.fas.usda.gov (web site accessed July 2012).
The USDA provide two sets of figures in their original data:
'Total Beginning Stocks' and
'Production Crop'. Beginning Stocks are the animals alive at the start of the year and breed the Production Crop. The number of Beginning Stocks remains roughly constant from year to year and it is largely the Production Crop that is slaughtered.
USDA state that their data are based on �USDA-FAS attache reports, official statistics, and results of office research� and that their data include only those countries which are the major animal producers. World Totals, therefore, are minimum figures.
Livestock are impossible to count accurately; therefore the figures in Table 1 and Table 2 are rounded to avoid spurious accuracy and totals may not necessarily add up exactly. Figures for 2012 are a projection.
›› To Entries & Home